
Non-Surgical Cosmetic Procedure Statistics: India and the World
The latest worldwide and India figures for injectables, laser hair removal, peels and skin tightening, from the International Society of Aesthetic Plastic Surgery's 2024 survey. Every number links to its source.
Last updated 6 October 2026Reviewed by The Aesthetic Edge medical team
Key statistics
Plastic surgeons performed 20,535,686 non-surgical cosmetic procedures worldwide in 2024.[1]
Botulinum toxin was the most common, with 7,887,955 procedures worldwide.[1]
India recorded 611,800 non-surgical procedures in 2024, out of 1,288,840 cosmetic procedures in total.[1]
India led the world in hair removal: 208,880 procedures, 14.0% of the global total.[1]
Hair removal made up 34.1% of all non-surgical procedures in India.[1]
India ranked 7th in the world for total cosmetic procedures, with 3.4% of the global total.[1]
Non-surgical skin tightening grew 38.9% worldwide between 2023 and 2024.[1]
47.1% of botulinum toxin procedures worldwide were on patients aged 35–50.[1]
How many non-surgical cosmetic procedures are performed worldwide each year?
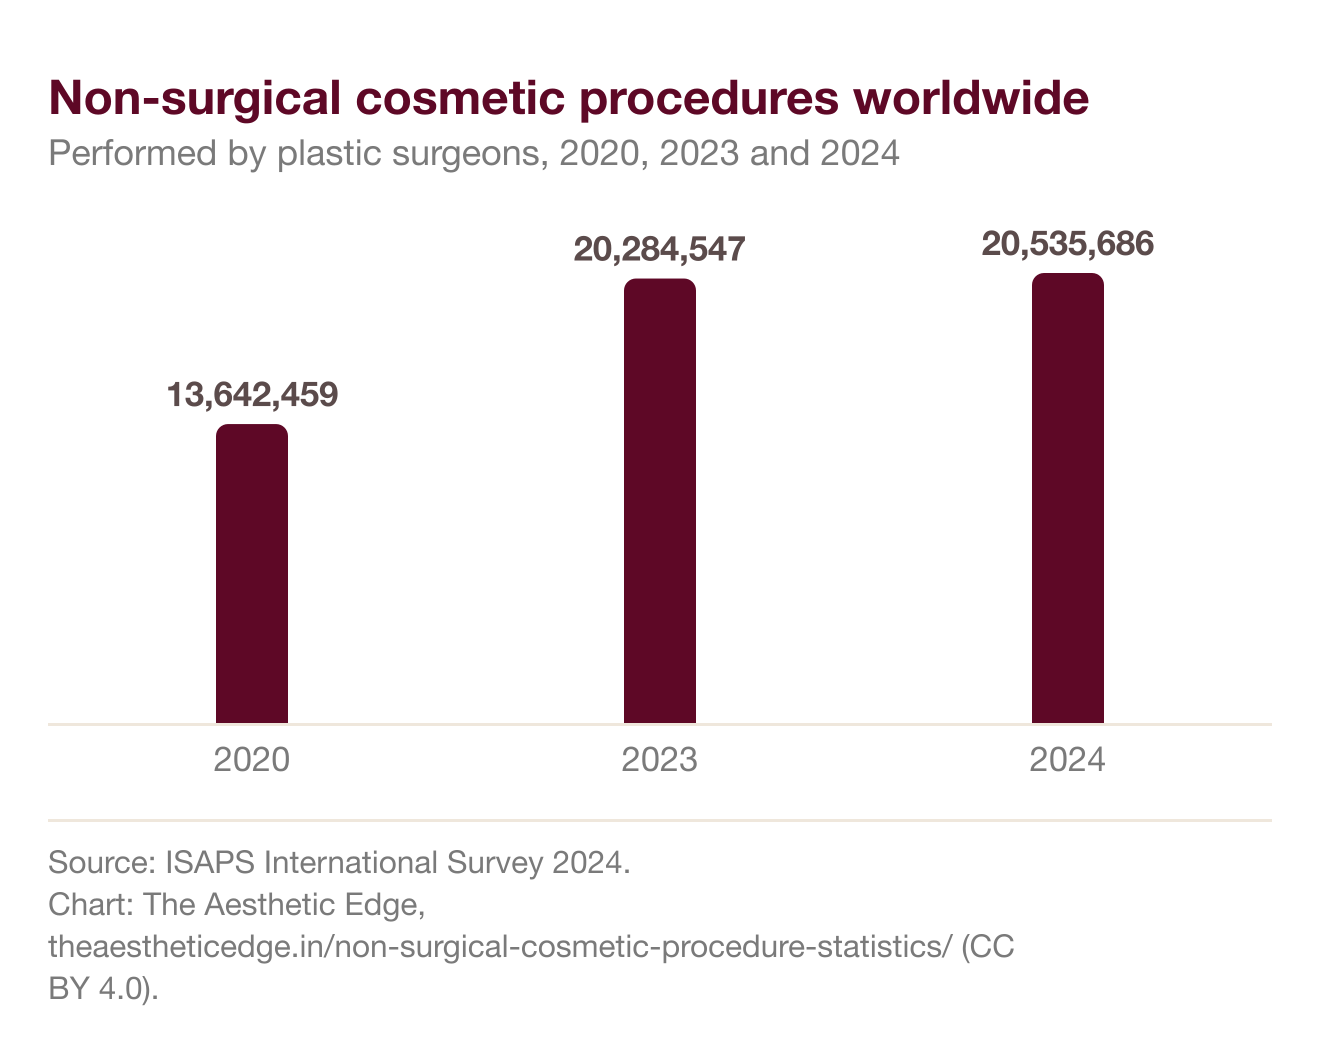
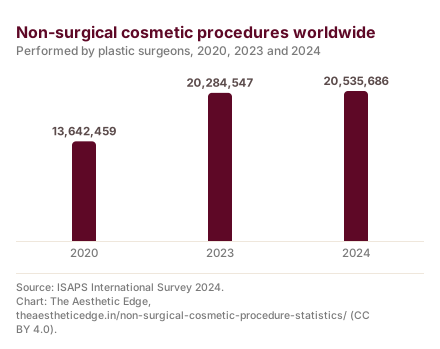
Plastic surgeons performed 20,535,686 non-surgical cosmetic procedures worldwide in 2024, according to the International Society of Aesthetic Plastic Surgery (ISAPS).[1]
That compares with 20,284,547 in 2023 and 13,642,459 in 2020. ISAPS calculates its year-on-year changes only from procedures surveyed in both years, which puts 2024 at 3.1% below 2023 and 39.6% above 2020.[1]
What is the most popular non-surgical cosmetic procedure in the world?
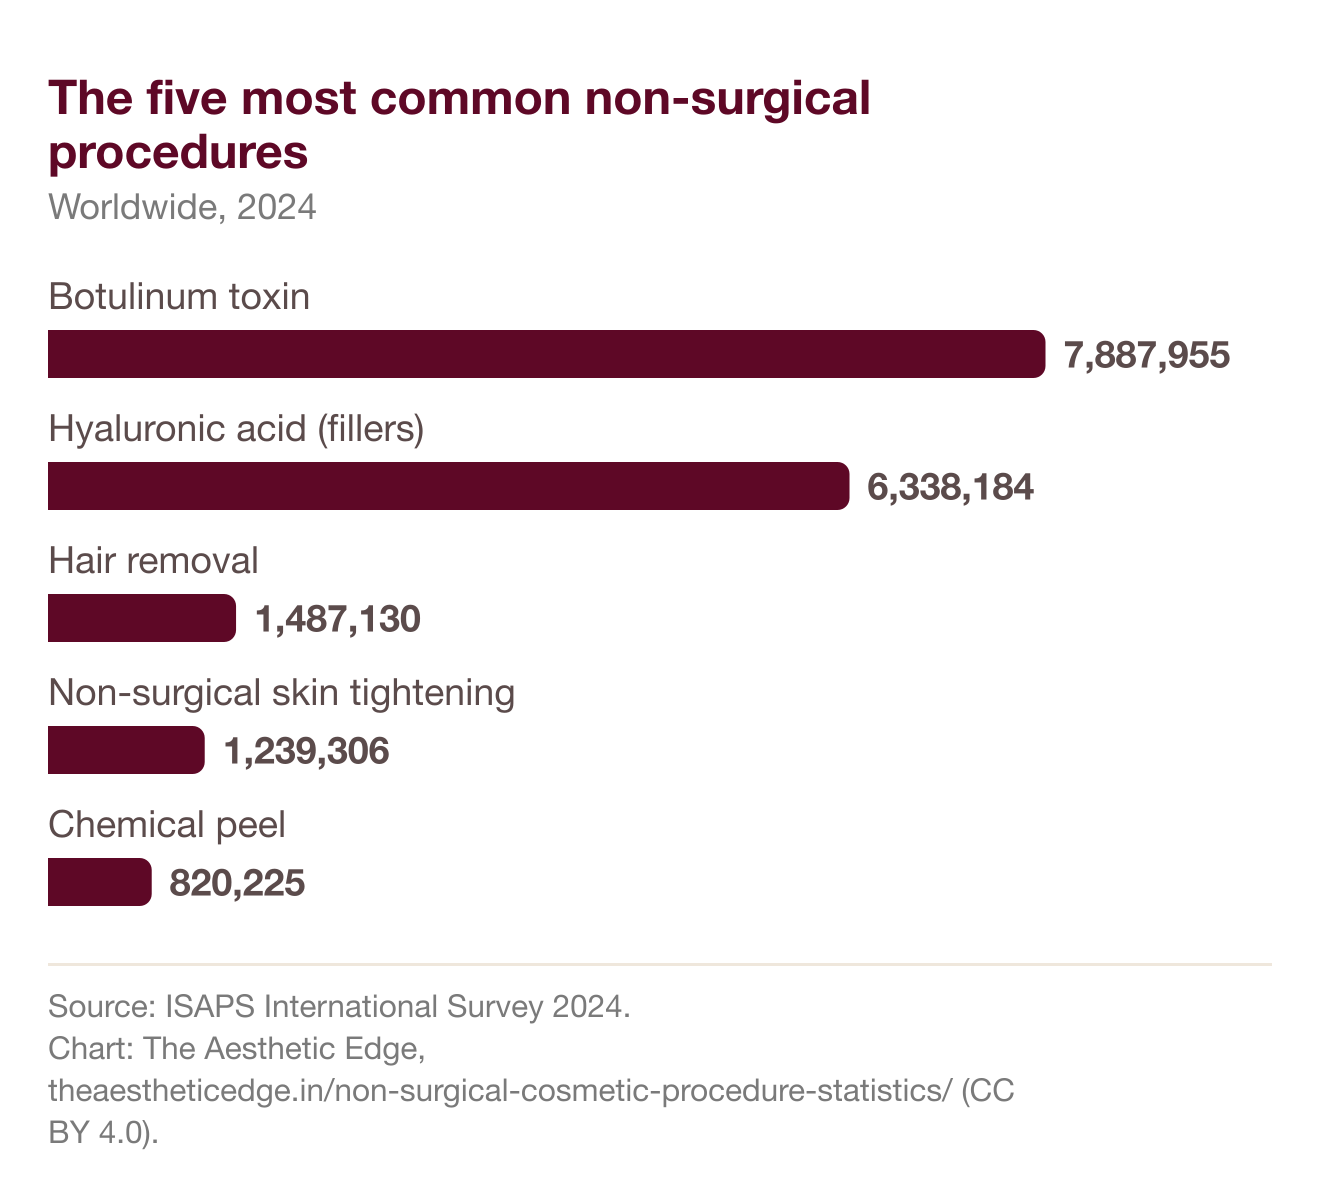
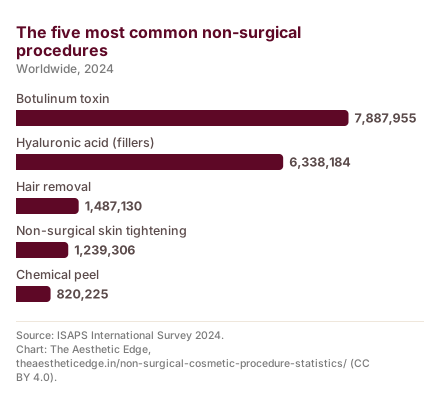
Botulinum toxin injections were the most common non-surgical cosmetic procedure worldwide in 2024, with 7,887,955 procedures.[1]
Hyaluronic acid fillers came second with 6,338,184, followed by hair removal, non-surgical skin tightening and chemical peels.[1]
| Procedure | 2024 | 2023 | 2020 | Change 2024 vs 2023 | Change 2024 vs 2020 |
|---|---|---|---|---|---|
| Botulinum toxin | 7,887,955 | 9,549,245 | 6,213,859 | -17.4% | 26.9% |
| Hyaluronic acid (fillers) | 6,338,184 | 6,025,911 | 4,053,016 | 5.2% | 56.4% |
| Hair removal | 1,487,130 | 1,708,342 | 1,837,052 | -12.9% | -19.0% |
| Non-surgical skin tightening | 1,239,306 | 892,180 | — | 38.9% | — |
| Chemical peel | 820,225 | 615,407 | 409,054 | 33.3% | 100.5% |
| Full-field ablative resurfacing | 752,717 | 472,853 | 225,141 | 59.2% | 234.3% |
| Non-surgical fat reduction | 702,836 | 652,962 | 560,464 | 7.6% | 25.4% |
| Poly-L-lactic acid | 642,566 | — | 121,087 | — | 430.7% |
| Calcium hydroxylapatite | 418,173 | 367,646 | 222,785 | 13.7% | 87.7% |
| Tattoo removal | 246,594 | — | — | — | — |
| Total non-surgical | 20,535,686 | 20,284,547 | 13,642,459 | -3.1% | 39.6% |
Percentage changes are as printed by ISAPS, which compares only procedures surveyed in both years. “—” means ISAPS did not survey that procedure in that year.
How has demand for non-surgical cosmetic procedures changed since 2020?
Worldwide, non-surgical procedures were 39.6% higher in 2024 than in 2020 but 3.1% lower than in 2023, on ISAPS's like-for-like basis.[1]
The fastest growth between 2023 and 2024 was in full-field ablative resurfacing (59.2%), non-surgical skin tightening (38.9%) and chemical peels (33.3%). Botulinum toxin fell 17.4% and hair removal 12.9%.[1]
How many non-surgical cosmetic procedures are performed in India?
Plastic surgeons in India performed 611,800 non-surgical cosmetic procedures in 2024, out of 1,288,840 cosmetic procedures in total.[1]
The other 677,040 were surgical. The 2023 survey put India at 496,931 non-surgical procedures and 1,028,723 in total, but the two years are not directly comparable: ISAPS received data from 2,975 surgeons for 2024 and from more than 1,600 for 2023.[1][2]
What are the most popular non-surgical cosmetic procedures in India?
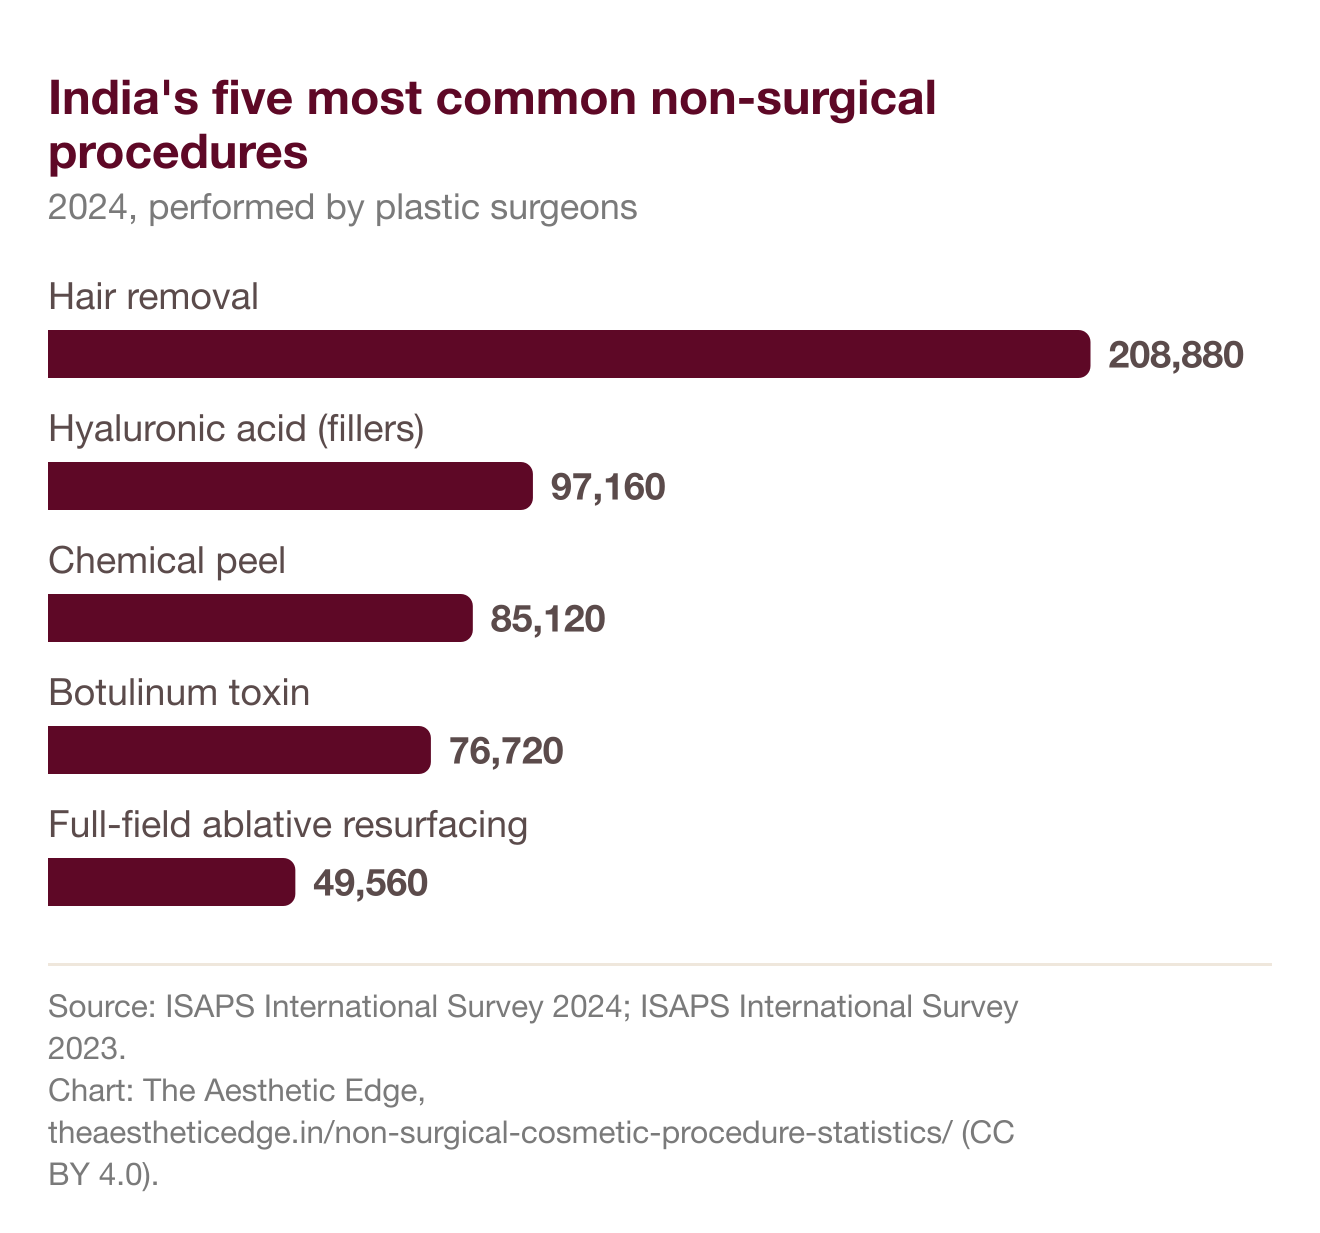
Hair removal was India's most common non-surgical cosmetic procedure in 2024, with 208,880 procedures, 34.1% of the national total.[1]
It was followed by hyaluronic acid fillers (97,160), chemical peels (85,120) and botulinum toxin (76,720). In 2023, botulinum toxin had been India's most common non-surgical procedure, with 115,194.[1][2]
| Procedure | 2024 | Share of 2024 total | 2023 |
|---|---|---|---|
| Hair removal | 208,880 | 34.1% | 97,601 |
| Hyaluronic acid (fillers) | 97,160 | 15.9% | 107,100 |
| Chemical peel | 85,120 | 13.9% | 70,198 |
| Botulinum toxin | 76,720 | 12.5% | 115,194 |
| Full-field ablative resurfacing | 49,560 | 8.1% | 24,075 |
| Non-surgical skin tightening | 35,280 | — | 45,463 |
| Tattoo removal | 31,920 | — | — |
| Non-surgical fat reduction | 21,560 | — | 33,555 |
| Poly-L-lactic acid | 5,320 | — | — |
| Calcium hydroxylapatite | 280 | — | 250 |
| Cellulite treatment | — | — | 3,495 |
| Total non-surgical | 611,800 | — | 496,931 |
ISAPS prints a share of the total for India's top five procedures only. “—” means no figure was published for that year.
Where does India rank in the world for cosmetic procedures?
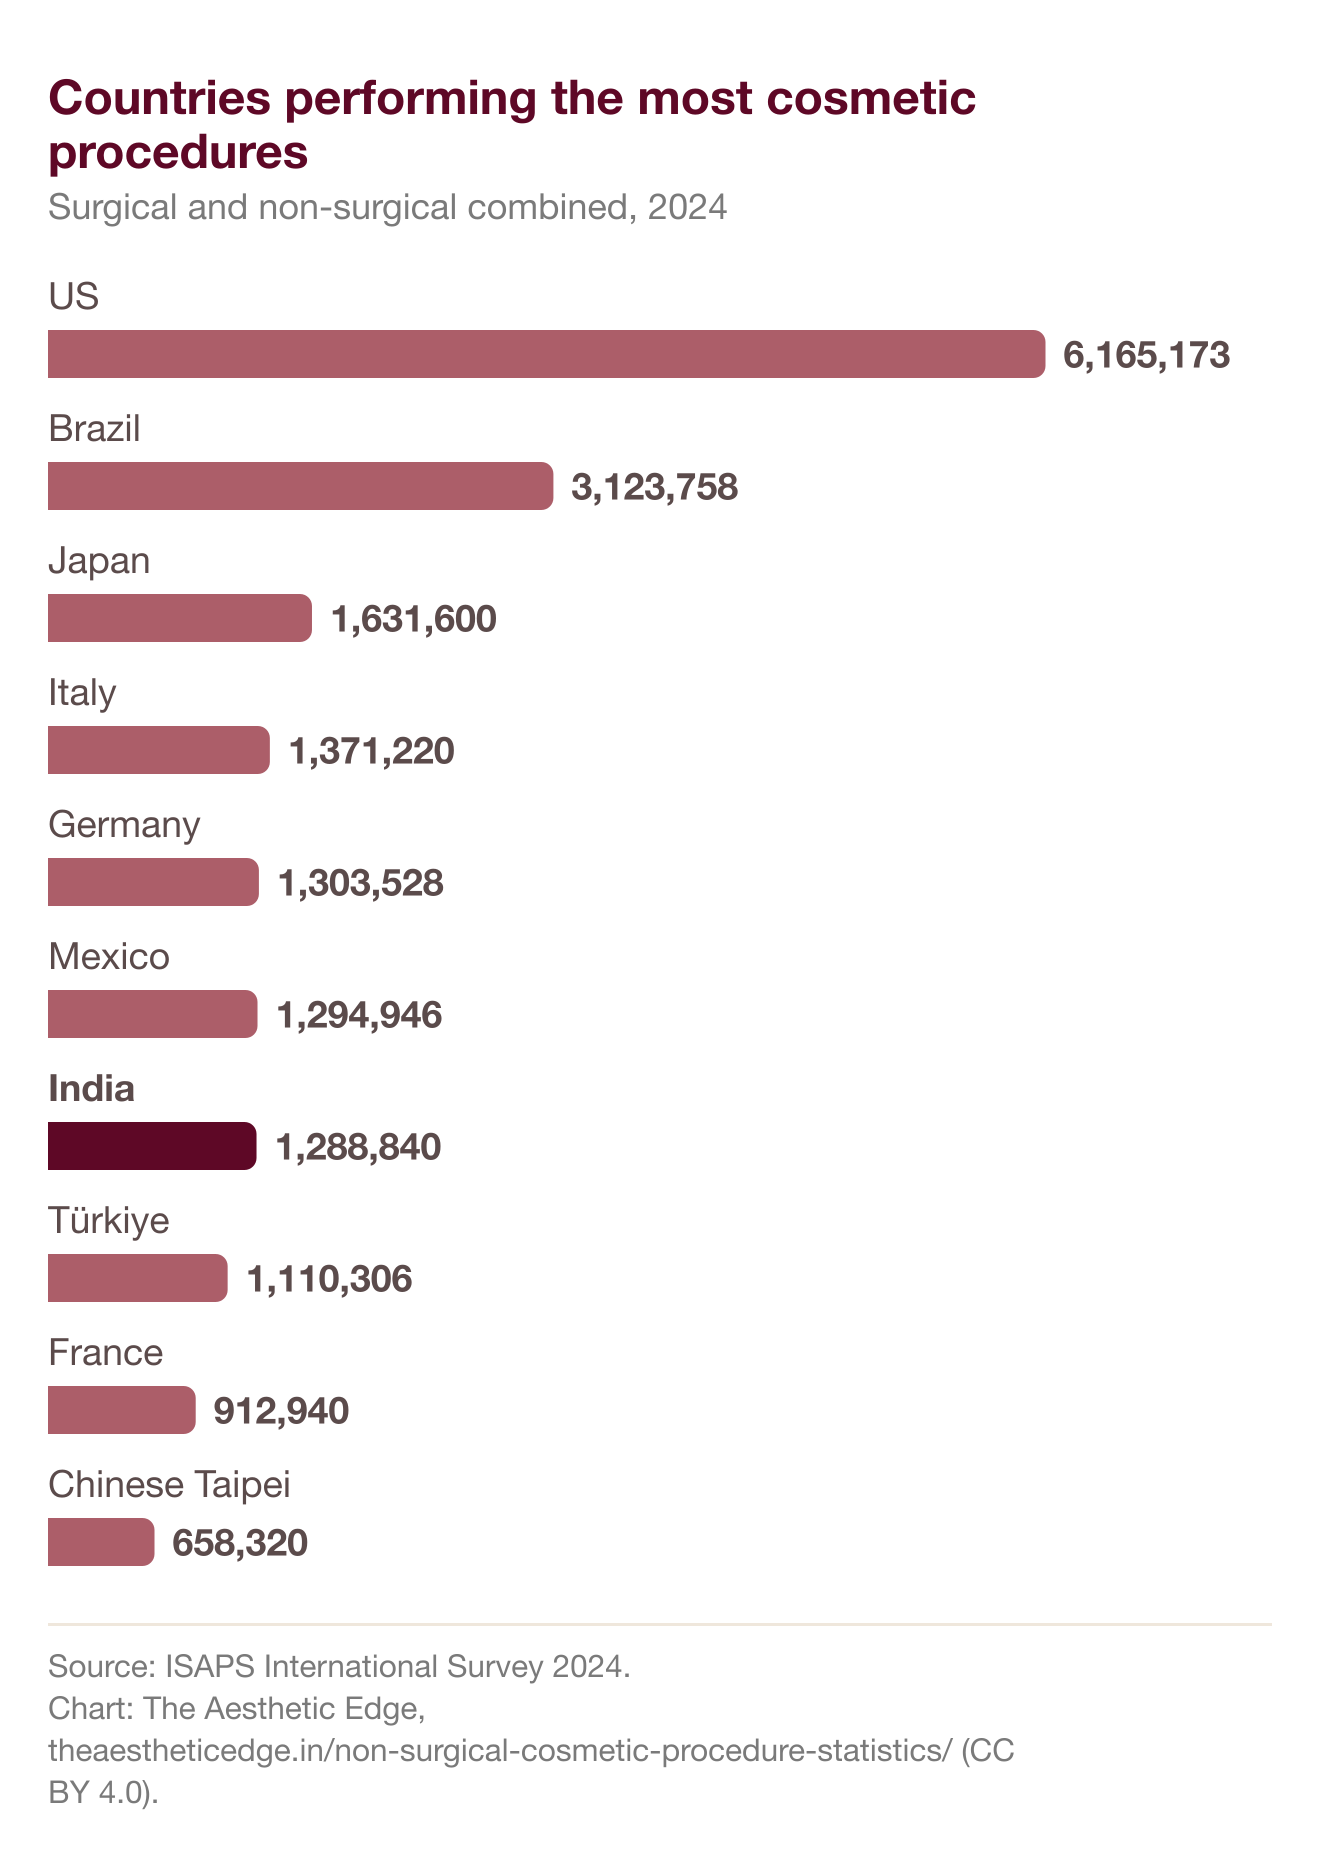
India ranked 7th in the world for total cosmetic procedures in 2024, with 3.4% of the global total.[1]
| Rank | Country | Surgical | Non-surgical | Total | Share of world total |
|---|---|---|---|---|---|
| 1 | US | 1,999,528 | 4,165,645 | 6,165,173 | 16.2% |
| 2 | Brazil | 2,354,513 | 769,245 | 3,123,758 | 8.2% |
| 3 | Japan | 380,000 | 1,251,600 | 1,631,600 | 4.3% |
| 4 | Italy | 480,047 | 891,172 | 1,371,220 | 3.6% |
| 5 | Germany | 626,215 | 677,313 | 1,303,528 | 3.4% |
| 6 | Mexico | 734,082 | 560,865 | 1,294,946 | 3.4% |
| 7 | India | 677,040 | 611,800 | 1,288,840 | 3.4% |
| 8 | Türkiye | 570,478 | 539,828 | 1,110,306 | 2.9% |
| 9 | France | 415,800 | 497,140 | 912,940 | 2.4% |
| 10 | Chinese Taipei | 257,480 | 400,840 | 658,320 | 1.7% |
Country names as ISAPS prints them.
Which country performs the most cosmetic hair removal procedures?
India performed more cosmetic hair removal procedures than any other country in 2024: 208,880, or 14.0% of the world total.[1]
India also ranked 3rd in the world for chemical peels (85,120 procedures, 10.4% of the world total) and 4th for non-surgical skin tightening (35,280, 2.8%).[1]
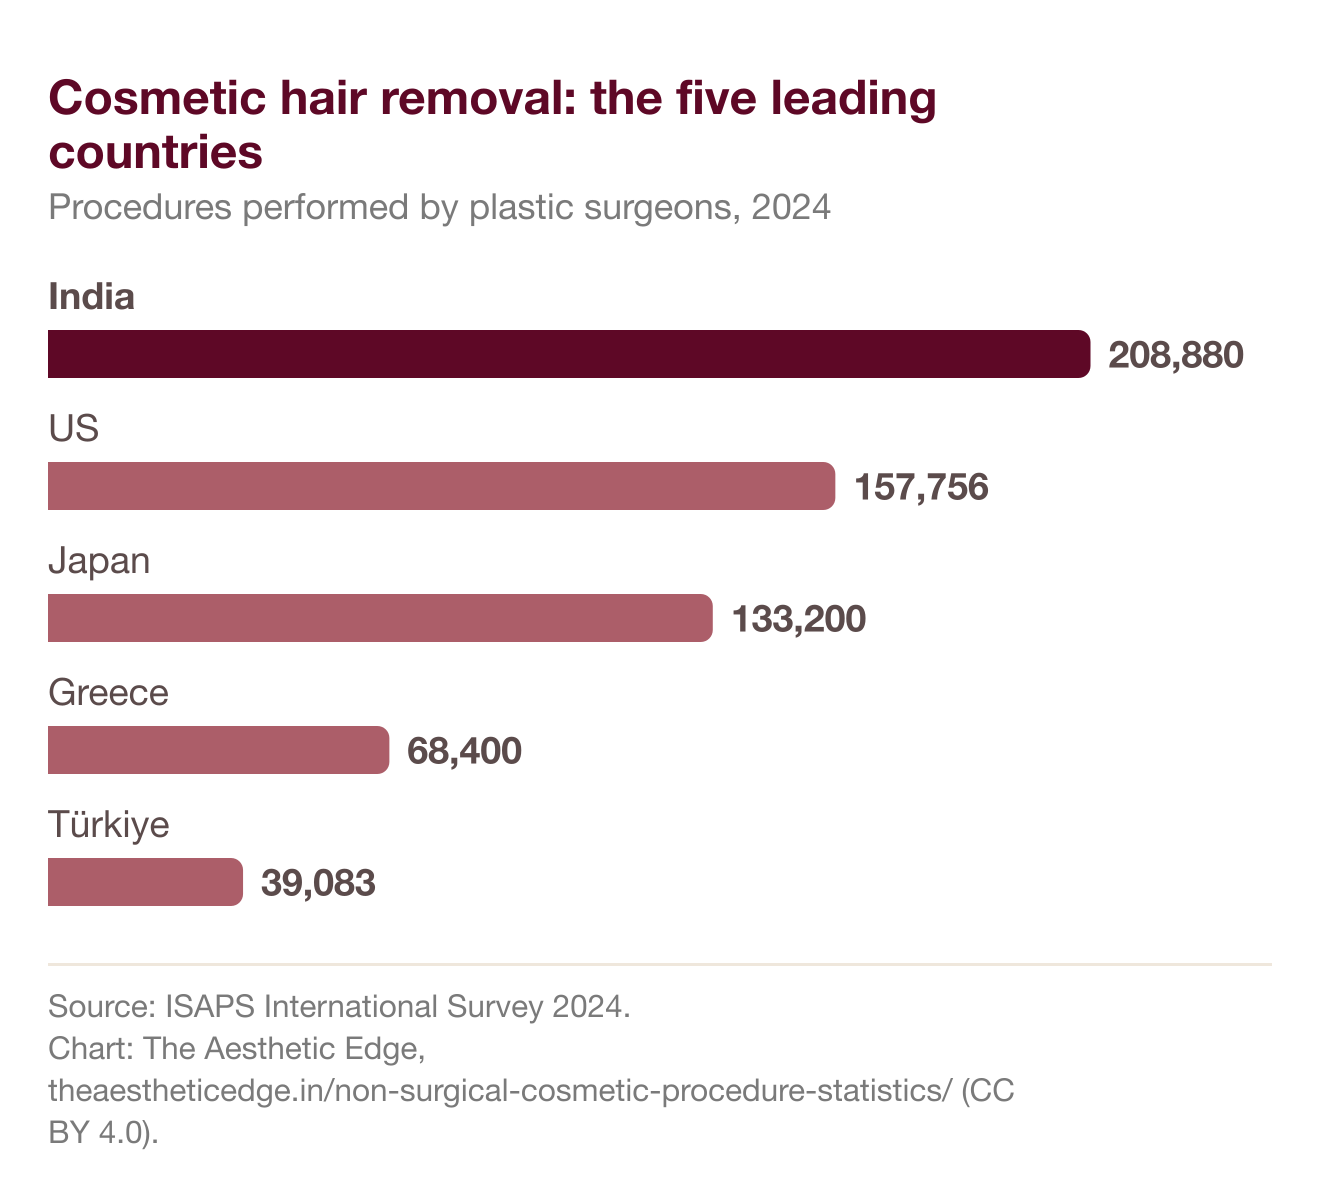
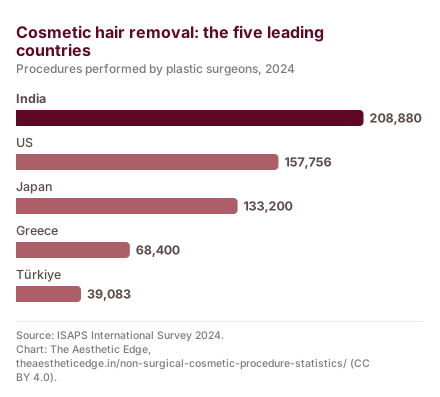
| Rank | Country | Procedures | Share of world total |
|---|---|---|---|
| 1 | India | 208,880 | 14.0% |
| 2 | US | 157,756 | 10.6% |
| 3 | Japan | 133,200 | 9.0% |
| 4 | Greece | 68,400 | 4.6% |
| 5 | Türkiye | 39,083 | 2.6% |
| Procedure | India's world rank | Procedures in India | Share of world total |
|---|---|---|---|
| Hair removal | 1 | 208,880 | 14.0% |
| Chemical peel | 3 | 85,120 | 10.4% |
| Non-surgical skin tightening | 4 | 35,280 | 2.8% |
ISAPS publishes top-10 country rankings for the five most common non-surgical procedures. India is not in the top 10 for botulinum toxin or hyaluronic acid.
Who has non-surgical cosmetic procedures?
Most botulinum toxin procedures worldwide in 2024 were on patients aged 35–50 (47.1%), and 6,622,473 of the 7,887,955 were on women.[1]
| Age group | Procedures | Share |
|---|---|---|
| 17 or younger | 39,440 | 0.5% |
| 18–34 | 1,798,454 | 22.8% |
| 35–50 | 3,715,227 | 47.1% |
| 51–64 | 1,861,557 | 23.6% |
| 65 or older | 473,277 | 6.0% |
| Procedure | Women | Men |
|---|---|---|
| Botulinum toxin | 6,622,473 | 1,265,482 |
| Hyaluronic acid (fillers) | 5,458,666 | 879,517 |
| Hair removal | 1,224,695 | 262,435 |
| Non-surgical skin tightening | 1,046,361 | 192,946 |
ISAPS does not publish an age or sex breakdown for India.
How reliable are these numbers?
They are ISAPS projections from a survey of plastic surgeons, so non-surgical procedures performed by dermatologists and other doctors are not included.[1]
ISAPS scales its survey responses up to the estimated number of plastic surgeons in each country. Its sample grew from more than 1,600 surgeons for 2023 to 2,975 for 2024, and it added procedures to the form, so it warns that totals are not fully comparable between years. ISAPS asks to be credited whenever its data is cited.[1][2]
How do I cite or reuse this data?
Cite this page, and the original source of any figure you quote. The numbered sources below link to each one.
The Aesthetic Edge. “Non-Surgical Cosmetic Procedure Statistics: India & World.” Last updated 6 October 2026. https://theaestheticedge.in/non-surgical-cosmetic-procedure-statistics/
The charts and text on this page are licensed under CC BY 4.0: you may republish them, including commercially, if you credit The Aesthetic Edge and link to this page. The credit line is built into every chart image. The figures themselves belong to the publishers listed under Sources, and their own terms apply, so credit them too.
Spotted an error? Tell us through our contact page and we will check it against the source.
Sources
- International Society of Aesthetic Plastic Surgery (ISAPS). ISAPS International Survey on Aesthetic/Cosmetic Procedures Performed in 2024. Published 2025. https://www.isaps.org/media/razfvmsk/isaps-global-survey-2024.pdf (accessed 6 October 2026).
- International Society of Aesthetic Plastic Surgery (ISAPS). ISAPS International Survey on Aesthetic/Cosmetic Procedures Performed in 2023. Published 2024. https://www.isaps.org/media/rxnfqibn/isaps-global-survey_2023.pdf (accessed 6 October 2026).
Related at The Aesthetic Edge
Get a doctor's read before you decide anything
₹500 consultation, waived off against your treatment. Indiranagar or Bellandur — closed Wednesdays.
General information, not medical advice — your treatment is decided at an in-person consultation. Terms & Conditions